Injection Molding Defects

Failure Analysis of Injection Molded Parts
Solution Viscosity – Viscosity Number and Intrinsic Viscosity
Various molding defects can occur during injection molding, such as streaks, sink marks, blistering, weld lines, gloss variations, matte spots, warpage, etc. Some affect the visual appearance and can lead to complaints, while others degrade mechanical properties and can even lead to premature failure.
This can also negatively impact further processing, such as electroplating.
Failure analysis of injection molding defects begins with defect classification based on features on the component surface or cross-sectional examinations. By identifying various defect characteristics, the physical causes can be narrowed down. An analysis of influencing factors provides insights for defect reduction or prevention by adjusting processing parameters. Our specialized testing laboratory for plastics analyzes damage cases in injection molded parts.
Defects in Plastic Electroplating
Today, PC/ABS materials are mostly used for plastic electroplating. The quality of electroplated plastic surfaces is also influenced by the manufacturing conditions of the plastic parts themselves. High rejection rates often occur due to pimples, specks, blisters, or insufficient layer adhesion. The causes for these defects can be found in both the injection molding process and the electroplating process.
Injection molding defects on the raw part are usually also visible on the finished electroplated component. However, hidden defects not observed on the raw part can be amplified and thus become visible during the electroplating process. Additionally, defect patterns can arise from deposition irregularities in electroplating, aging of baths, or unsuitable electroplating conditions.
A systematic, microscopic analysis of the finished part and the raw part helps to determine the cause of defects in electroplated plastic parts and reduce rejection rates.
Contamination of Components
Contamination can occur at every process step, from raw materials to transport. Various spectroscopic and microscopic methods are used for failure analysis depending on the type of contamination.
For liquid raw materials, NMR spectroscopy is recommended for detecting organic impurities, while XRF spectroscopy is suitable for inorganic trace impurities.
For surface contamination, scanning electron microscopy and IR spectroscopy are used to analyze the defects. The composition and morphology of the contamination provide clues about its origin. Some contaminations are invisible but can cause problems during further processing. Specially adapted investigation methods are required here.
A systematic failure analysis enables the characterization and determination of the causes of contamination on plastic parts, which contributes to reducing rejection rates. Our failure analysis, tailored to your requirements, can help with this.
Application Examples
Flow Line Analysis Injection Molding
Injection Molded Parts – a Detailed Look
Objective
During injection molding and thermal forming of polymers, it is necessary to optimize the polymer flow. Only in this way can all corners and edges be sufficiently supplied with polymer, and weak points in the component due to unsuitable processing conditions be avoided.
Solution
In such cases, Analytik Service Obernburg GmbH creates microtome cross-sections through the areas of interest and uses special imaging methods of light microscopy to visualize the flow lines in the polymer.
- Industries: Plastics
- Analysis Objectives: Failure Analysis, Process Optimization
- Materials: Injection Molded Parts
- Analysis Methods: Light Microscopy, Microtome Sections
Advantages
The described method allows for the visualization and analysis of flow lines within polymers. At the same time, the shape (e.g., dimensional accuracy) of the components and any defects (e.g., gas bubbles) in the polymer can be examined.
Example – Weak Point in Injection Molded Part
Based on the investigations, the weak point in the component could be attributed to a contact point between two polymer fronts (Fig. 1), which does not form a sufficient bond. Due to adjustments of the gate locations, the contact point could be relocated to an area that is uncritical for the component properties.

Fig. 1: Weak point due to contact line of two polymer fronts
Example – Flow Lines behind an Obstacle
Based on the investigations, the weak point in the component could be attributed to a disturbance in the polymer flow caused by an obstacle in the molded part (Fig. 2). At this point, a swirling of the flow lines occurred, leading to inhomogeneities in the polymer structure. These can impair the mechanical properties of the component. By optimizing the mold design or process parameters, the flow guidance can be improved, thus avoiding the source of error.

Fig. 2: Swirling of flow lines behind an obstacle (notch)
Example – Welding of Polymer Ribs
Ribs were used to connect two materials, which were thermally formed into a head at their end. The head prevents the rib from being pulled out of the hole. Based on the structures in the cross-section (Fig. 3), it can be seen that the left of the two ribs was bent and folded in a zigzag pattern during welding (red arrow). In contrast, for the right pin, the polymer was squeezed out laterally from the rib on both sides.
Additionally, the positioning of the tool in relation to the web can be controlled based on the shape of the head (Fig. 3). Both images show a slight displacement of the head to the left. Furthermore, a core-edge effect is observed in the shaft area of both webs. This indicates different cooling conditions during the manufacturing of the webs. Its intensity varies.

Fig. 3: Flow line analysis on welded ribs for optimizing process parameters
Electroplating of Plastic
Blistering on Electroplated Component
Determining Defect Causes After Climate Simulation
Objective
Several seemingly flawless electroplated PC/ABS components showed significant blistering in some areas after a temperature change test (Fig. 1). This led to the blocking of the entire production batch.
Solution
At Analytik Service Obernburg, the blister was opened. The polymer surface beneath the blister appears darker than in the freshly peeled reference area (red arrow in Fig. 2). In the blister area, hardly any polymer adheres to the metal, whereas the adhesion in the reference area is so high that when the metal layer was peeled off, a part of the polymer was torn away with it – the underside of the metal is covered with numerous polymer remnants (Fig. 3).
In a further step, the polymer in the reference area was chemically dissolved, and the metal underside was exposed (Figs. 4 and 5), revealing a cavernous structure of varying prominence.
- Industries: Automotive Suppliers, Electroplating Companies, Plastic Processors, Medical Technology
- Analysis Objectives: Failure Analysis, Process Optimization
- Materials: Electroplated Plastics
- Analysis Methods: Scanning Electron Microscope
- Supplementary Methods: Light Microscopy, IR Spectroscopy, Climate Storage, First Article Inspections
- Related Issues: Defect Analysis, Crater Paint Adhesion, Wetting Problems

Fig. 1: Electroplated Component with Blistering

Fig. 2: Opened Blister

Fig. 3: Underside of metal in the reference area with adhering polymer

Fig. 4: Underside of metal in the blister area with relatively few anchoring points

Fig. 5: Cleaned metal underside in the reference area (many cavities allow for an intimate connection with the polymer)

Fig. 6a–c: surfaces etched to varying degrees
Objective
During electroplating, the butadiene component of the ABS is first oxidized in an etching process. This creates a cavernous structure, which is filled with metal in subsequent process steps, thereby creating anchoring. If the etching is too low (Fig. 6a), too few anchoring points are created. If, however, it is too high (Fig. 6c), too few polymer ribs remain, and the strength is also reduced.
Advantages
The described method allows for failure analysis of various defect patterns. The method is also suitable for determining the elemental composition in the defect area and thus identifying possible foreign materials.
Glass Fiber Orientation
Glass Fiber Reinforcement of Plastics – Made more Visible
Objective
Glass fibers are a commonly used filler to improve the mechanical properties, such as the strength, of a plastic. However, it is not only the filler content that matters, but also the homogeneity of the distribution and the orientation of the glass fibers within the component.
Incorrect distribution/orientation can lead to undesirable properties, up to the failure of the injection molded component.
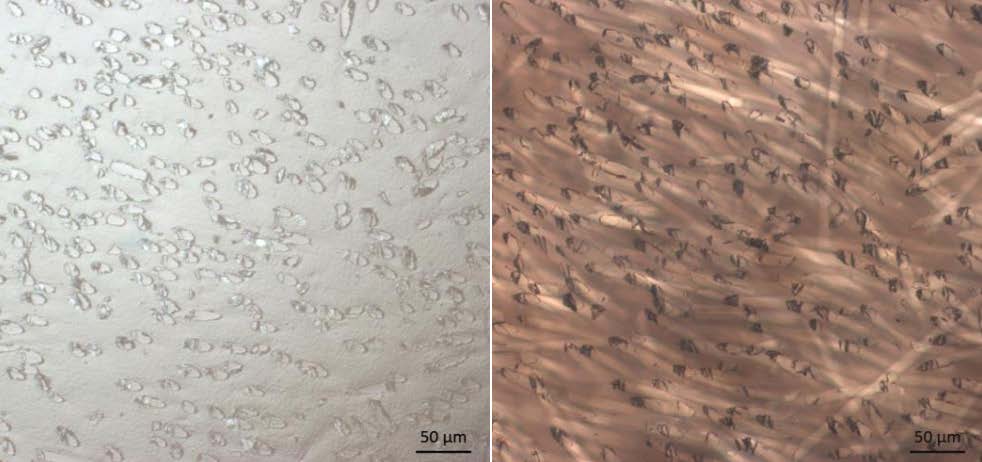
Glass fiber orientations can only be visualized in conventionally used polished sections if a large number of fibers lie parallel to the polished plane. However, this is only approximately the case very close to the surface.
Solution
Analytik Service Obernburg uses thin sections in addition to polished sections for the analysis of glass fiber orientation.
- Industries: Automotive Suppliers, Plastic Processors, Textile
- Analysis Objectives: Competent Execution of First Article Release Tests
- Materials: Finished Plastic Parts, Painted Components, Textiles
- Analysis Methods: Odor tests, among others, according to Ford BO 131-03, Hyundai MS 300-34, Opel/GM GMW 3205, PSA D10 5517, SAE J1351 VDA 270, Volvo STD 1027, 2712, VW/Audi PV 3900
- Related Issues: Emission Tests, VDA 278
Example – Improved Visualization of Glass Fiber Orientation
Because the fibers inside a component are always oriented slightly obliquely to the polished plane, only the penetration points of the glass fiber through the surface are visible in reflected light (corresponding to a normal polished section) (Fig. 1 left). Similar to a sausage cut, the resulting area is very small, and assessing the orientation is difficult.
In contrast, the glass fiber orientation is very clearly visible in the thin section (Fig. 1 right).

Fig. 1: Acrylate component of an embedding medium. Among other things, the final hardness is influenced by the average molar mass of the polymer.
Example – Investigation of Crack Formation in Glass Fiber Reinforced Components
An incipient crack is only recognizable in the polished section with very good polishing of the ground surface (yellow arrow in Fig. 2 left) and can easily be confused with scratches. In contrast, in the thin section preparation under transmitted light, the crack can be clearly seen, and the glass fiber orientation in the surroundings can be analyzed (Fig. 2 right). In the above case, the crack spread from top right to bottom left. In the right area of the image, the glass fibers are largely oriented perpendicular to the polished plane and can hardly influence crack propagation. In the left part of the image, however, the glass fiber orientation changes, and crack propagation was stopped.

Fig. 2: Investigation of crack propagation in relation to glass fiber distribution/orientation (Comparison of the same location in reflected light on the left and transmitted light on the right).
Advantages
The described thin section method allows for a significantly better visualization of the orientation of glass fibers in a polymer matrix. It can also be used when the glass fibers are not parallel to the grinding direction. Furthermore, it is possible to make statements about the polymer located between the glass fibers. The results can be used to optimize injection molding parameters or tooling in critical areas during the development of new products. In case of damage, it is possible to find the causes of quality problems (e.g., component breakage). Additionally, Analytik Service Obernburg offers extensive expertise in other microscopic methods, as well as chemical and spectroscopic analysis.
Raman Spectroscopy
Inclusion in Cable Insulation
Objective
A darker foreign material was observed in a transparent cable insulation. It is feared that this could affect the insulation performance. To assess the potential risk and narrow down the cause, a characterization of the defect is required.
Solution
After an inspection at Analytik Service Obernburg, it was decided, due to the moderate size of the defect, to create a simple cross-section with a scalpel (Fig. 1).
- Industries: Medical Technology, Paint Manufacturers, Compounders
- Analysis Objectives: Particle Size, Particle Shape, Agglomeration Tendency
- Materials: Powders, Suspensions
- Analysis Methods: Laser Diffraction, Scanning Electron Microscopy (SEM-EDX)
Solution
The defect was subsequently analyzed using micro-Raman spectroscopy (see Fig. 2). While the insulation consists of polyethylene (PE) (blue spectrum), the material of the defect (red spectrum) corresponds to a mixture of polyethylene (PE) and polytetrafluoroethylene (PTFE). For better comparison, a reference spectrum of PTFE (green spectrum) was added.
PTFE, also known as Teflon, should also be a good insulator. The material information allows for a more targeted approach in the search for the cause.
Advantages
Microscopic Raman spectroscopy enables the analysis of small inclusions with a spatial resolution of a few micrometers. The measurement is non-contact. The method is particularly suitable for organic materials (e.g., polymers).
In addition to Raman spectroscopy, Analytik Service Obernburg also offers IR spectroscopy and scanning electron microscopy (SEM-EDX) for failure analysis.

Fig. 1: Cross-section

Fig. 2

Fig. 3: Microscopic Raman Spectroscopy
Our Experts

